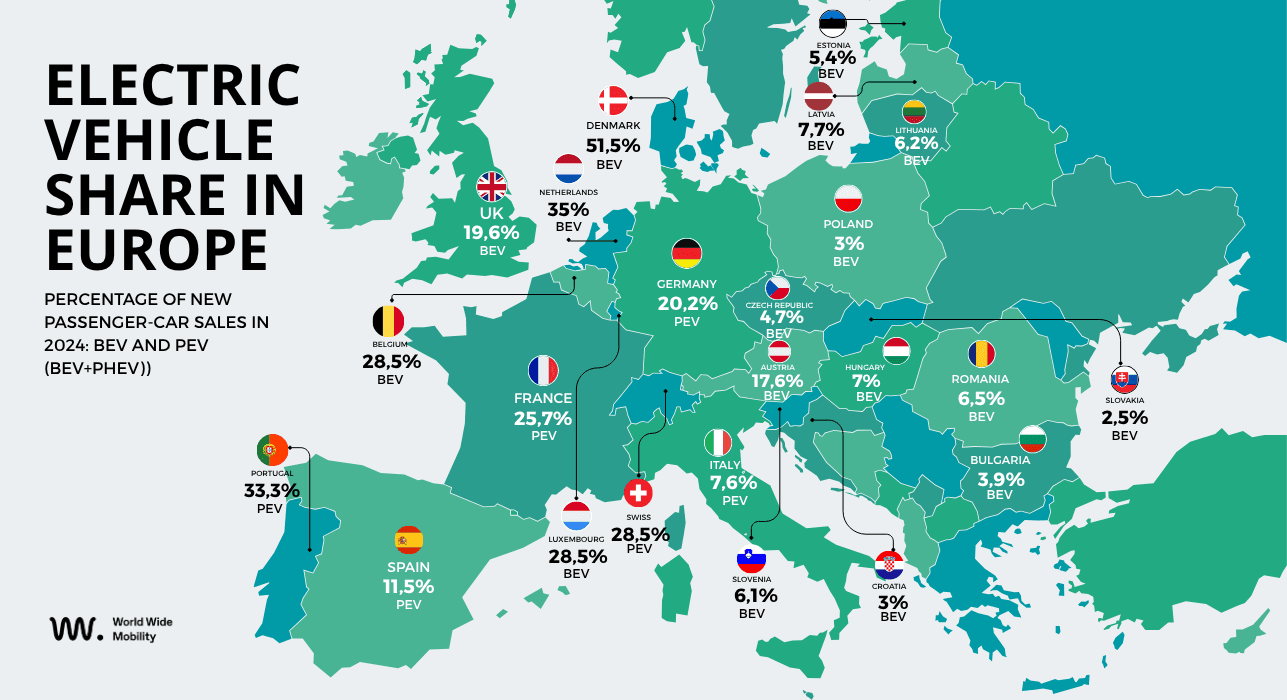
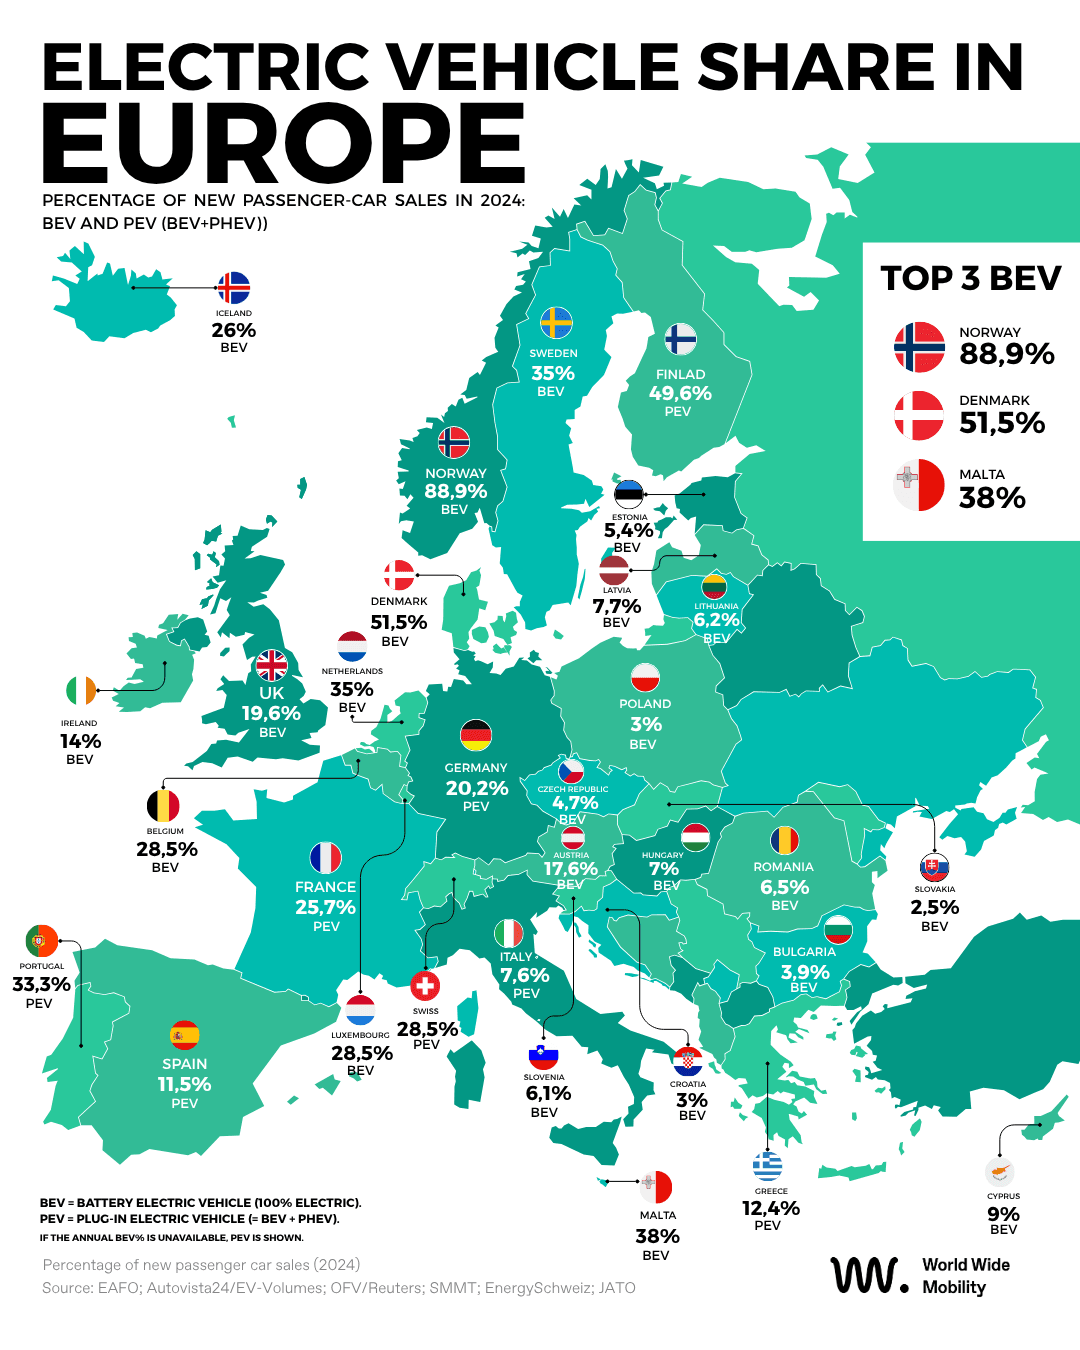
At World Wide Mobility, we mapped the penetration of electric vehicles in Europe in 2024 against total new passenger-car sales (combustion + electric). We prioritize BEV (100% battery electric). When the annual BEV% isn’t officially available, we use PEV = BEV+PHEV and make that explicit. The ranking and full list below reflect the dataset fields country, value, measure.
From Data to Insight, What the Map can tells us?
Nordic leadership, full electrification: Norway (88.9% BEV) and Denmark (51.5% BEV) lead the structural shift to pure electric.
Strong PEV markets: Finland (49.6% PEV) and Portugal (33.3% PEV) show plug-ins (BEV+PHEV) acting as a bridge toward BEV.
Large economies, steady pace: France (25.7 PEV), Germany (20.2 PEV) and the United Kingdom (19.6 BEV) consolidate volume and charging networks.
Central/Eastern Europe, uneven progress: from Greece (12.4 PEV) and Spain (11.5 PEV) to Slovakia (2.5 BEV), momentum is positive but heterogeneous.
What Drives EV Leaders: Policies, Infrastructure, and Incentives That Boost Adoption
Price signals & CO₂ based taxation: bonuses for EVs and higher taxes on ICE improve BEV competitiveness.
Reliable charging infrastructure: rapid charging corridors plus easier home/workplace installation.
Model availability & TCO: broader BEV line-ups across segments and a favorable total cost of ownership vs. ICE.
Corporate fleets: incentives for leasing/company cars accelerate renewal and feed the used-EV market.
Looking ahead: What will we see in the coming years?
Between 2025 and 2030, expect BEV to gain share over PHEV as range, battery costs and network density improve. More affordable models and public procurement will push adoption, while CO₂ policies keep the pressure to electrify.
Europe 2024 EV Share: Complete Country List (BEV & PEV)
| Country, | Percentage (%) | Measure |
|---|---|---|
| Norway | 88,9 | BEV |
| Denmark | 51,5 | BEV |
| Finland | 49,6 | PEV |
| Malta | 38 | BEV |
| Sweden | 35 | BEV |
| Netherlands | 35 | BEV |
| Portugal | 33,3 | PEV |
| Belgium | 28,5 | BEV |
| Switzerland | 28 | PEV |
| Luxembourg | 28 | BEV |
| Iceland | 26 | BEV |
| France | 25,7 | PEV |
| Germany | 20,2 | PEV |
| United Kingdom | 19,6 | BEV |
| Austria | 17,6 | BEV |
| Ireland | 14 | BEV |
| Greece | 12,4 | PEV |
| Spain | 11,5 | PEV |
| Cyprus | 9 | BEV |
| Latvia | 7,7 | BEV |
| Italy | 7,6 | PEV |
| Hungary | 7 | BEV |
| Romania | 6,5 | BEV |
| Lithuania | 6,2 | BEV |
| Slovenia | 6,1 | BEV |
| Estonia | 5,4 | BEV |
| Czech Republic | 4,7 | BEV |
| Bulgaria | 3,9 | BEV |
| Croatia | 3 | BEV |
| Poland | 3 | BEV |
| Slovakia | 2,5 | BEV |
Measure indicates whether the percentage is BEV or PEV (BEV+PHEV). BEV = battery electric vehicle (100% electric). PEV = BEV + PHEV (plug-ins). If the annual BEV% is unavailable, PEV is shown.